


| [Library] LineGraph-TFM |
 King_seniru King_seniru  « Censeur » 1566885900000
| 6 | ||
|
Features
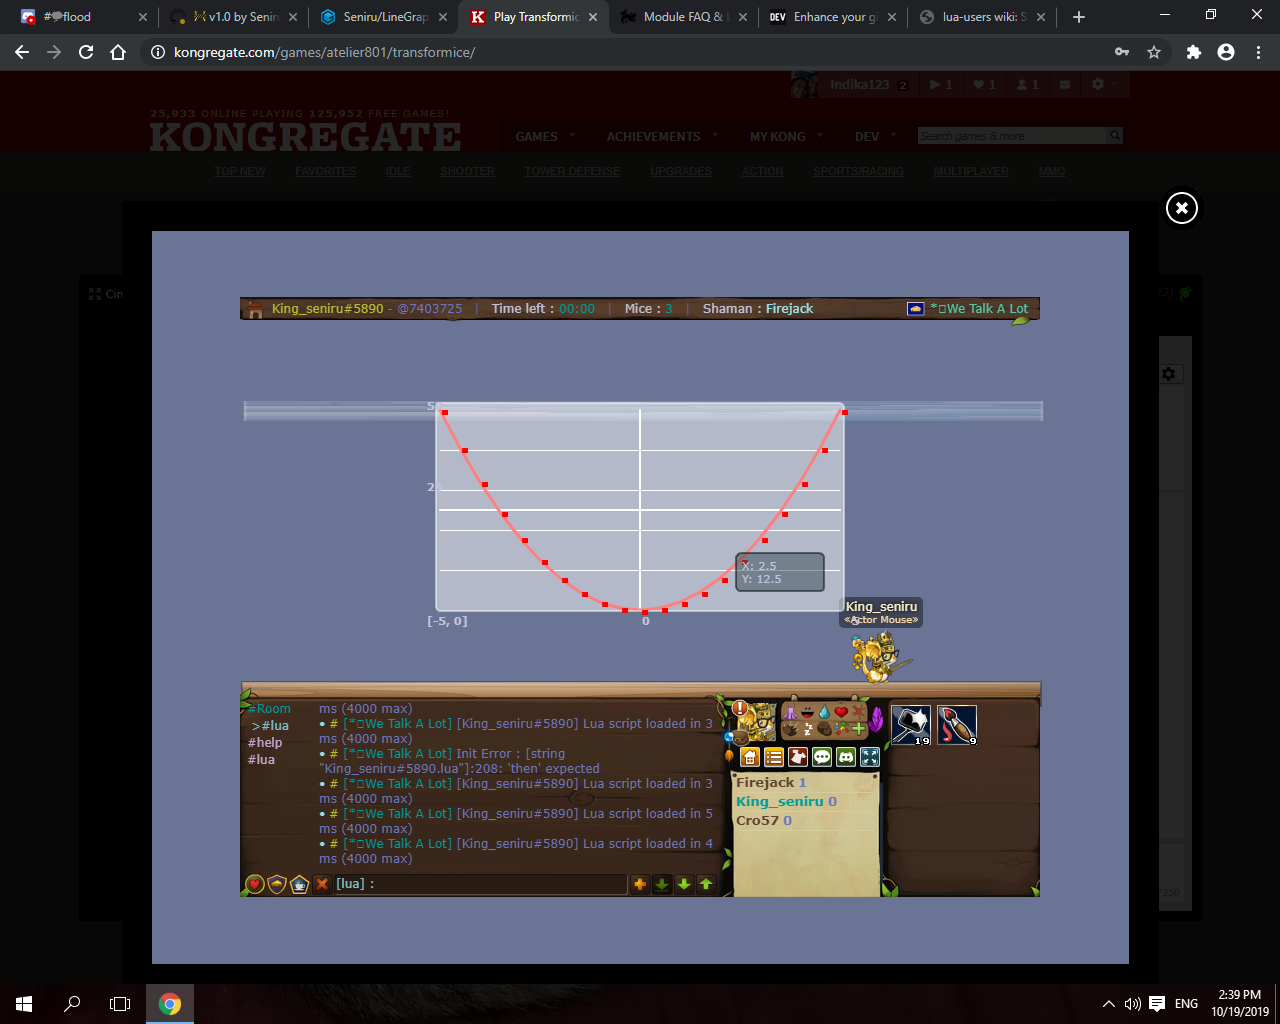
What's new! (v1.0-beta) Usage Usage is very simple, just include the library [Minfied] in the top of the file and start developing! Code Lua 1 2 3 4 5 6 7 8 9 10 11 12 13 14 --insert the library code before the script Check the documentation for the API and more! Demos y = x * x (or x^2) Code Lua 1 2 3 4 5 6 7 8 9 LineChart.init() --initializing Real time graphs! y = sin(x) * x * x * tanh(x) Code Lua 1 2 3 4 5 6 7 8 9 10 11 12 13 14 15 16 LineChart.init() Multi-Series Graphs (introducing) Code Lua 1 2 3 4 5 6 7 8 9 10 11 12 13 14 15 16 17 LineChart.init()
Ready to contribute this awesome project?
If your contribution is not code related or a bug report, don't worry! Still there are many ways you can help this! Just DM me to know more. Dernière modification le 1650003360000 |

 King_seniru
 Profil
 Derniers messages
 Tribu
Tribu


Overforyou  « Citoyen » 1566889980000
| 4 | ||
| I find this topic very useful and thank you for sharing your knowledge with us ^-^ |
| King_seniru « Censeur » 1568200920000
| 1 | ||
Overforyou a dit : Thanks overforyou! |
| King_seniru « Censeur » 1569051300000
| 1 | ||
| New Release!
|
| King_seniru « Censeur » 1571565780000
| 3 | ||
| New Release! v1.0 (beta) What's new
 |